
Highlight Photo
Elucidating the Role of Dynamics in IgE Receptor Signaling via Single Quantum Dot Tracking
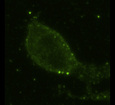
Confocal image series compressed into a single plane, depicting a live RBL-2H3 cell labeled with three spectrally distinct quantum dot-based probes.
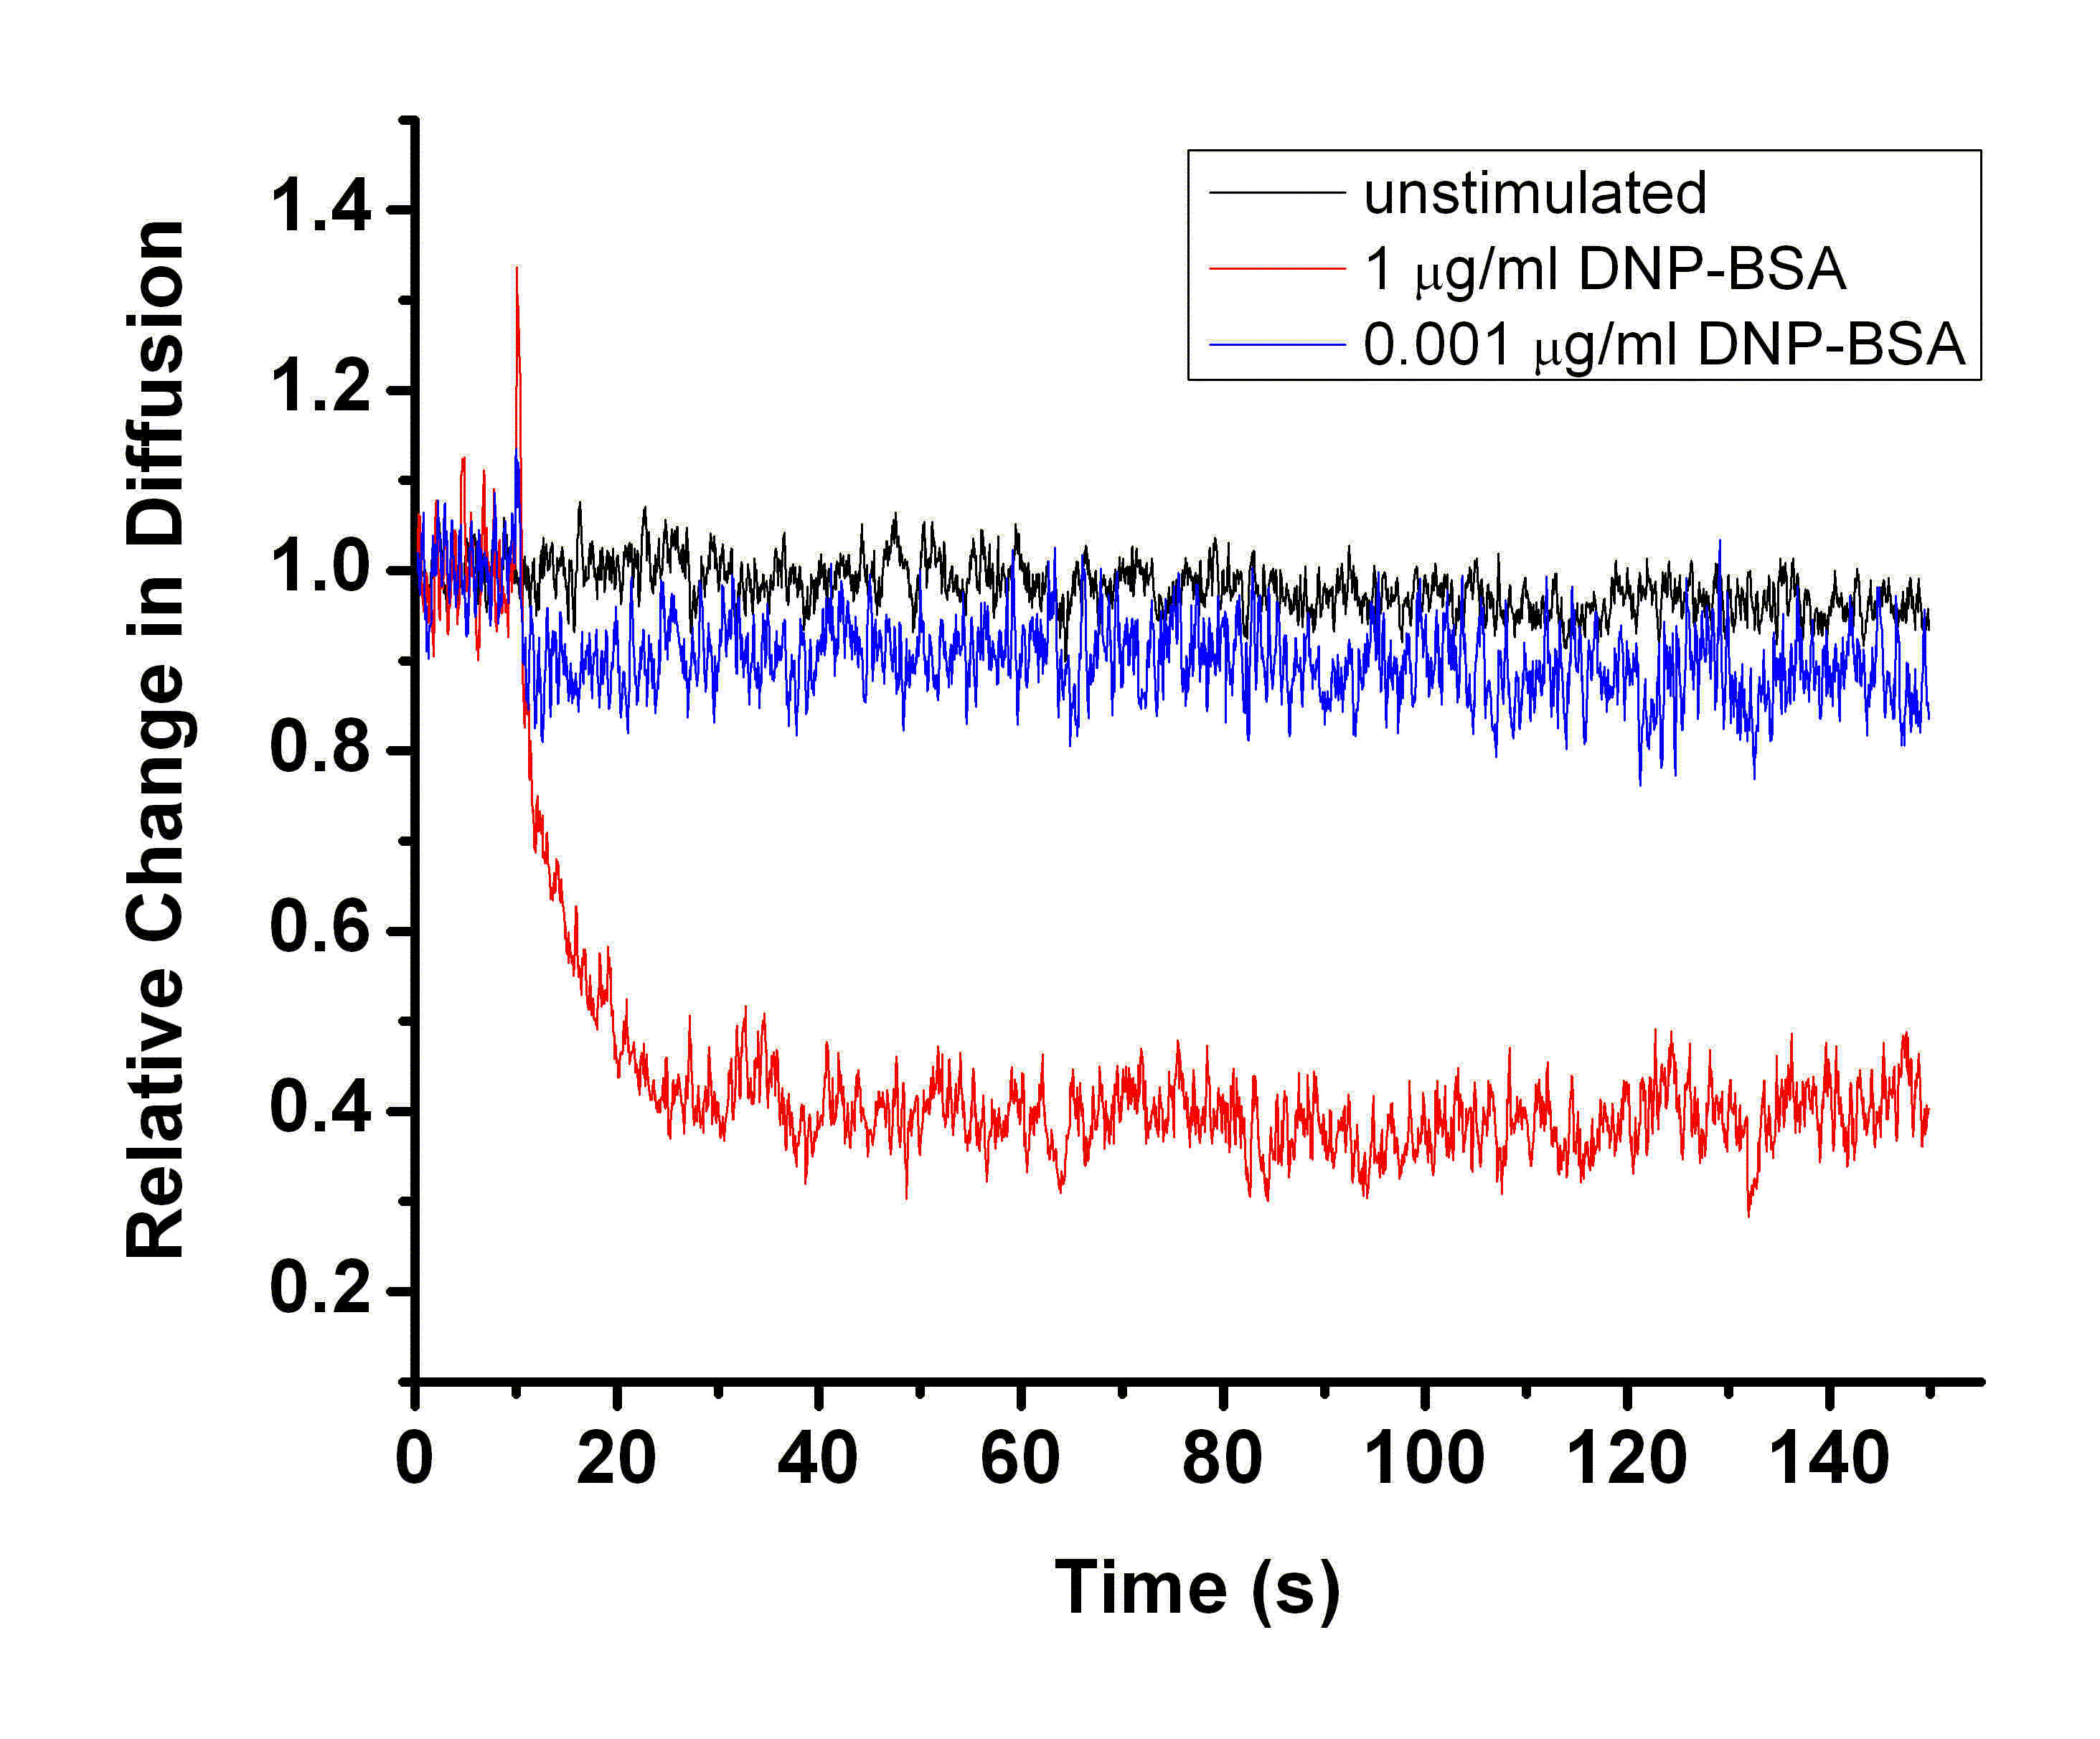
Figure 1. Plot showing relative change in FceRI diffusion as a function of time. DNP-BSA was added at the indicated concentrations after 10 s. Note dramatic decrease in diffusion with 1 µg/ml DNP-BSA, but very small change in diffusion at 0.001 µg/ml DNP-BSA, a dose that causes maximal cellular response.
Credits: Nicholas Andrews, Unversity of New Mexico