

Highlight
MRI classification using graphs and support vector machines
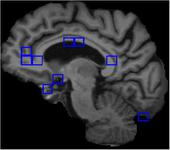
Image of an Alzheimer’s Patient
Achievement/Results
Machine learning methods can be applied to MRI scans of teh brain in order to classify images as having, or not having, particular characteristics such as Alzheimer’s Disease, advanced age, or a high level of education. However, medical practitioners prefer classification methods which generate a rational explanation of the reasons for a particular choice. In addition, knowing which attributes are useful for making a particular classification can increase our knowledge of the brain. We extend previous work to improve accuracy and to product a comprehensible explanation of why a particular classification was made. This is tested on a dataset of 416 individuals and classifications based on age, level of education, and Alzheimer’s Disease.
The process of extracting useful information from large volumes of data is of particular relevance in the field of medicine. Modern technology has enabled creation of images of structures inside the living body. Noticing correlations between these 3D images has been the subject of a number of studies, and in some cases correlations have been found. Applying data mining techniques to automatic discovery of these correlations can enable automatic discovery of patterns which may otherwise remain undiscovered.
One sort of medical data which may be classified is MRI scans of the brain. For example, a number of methods have been devised to automatically classify images according to cognitive impairment due to Alzheimer’s Disease. Scans may also be classified according to age or level of education of an individual, or even whether or not the individual was a musician. These algorithms are based on automatic discovery of features which correlate with a particular classification, and utilization of these features to predict the correct class label.
A graph based approach to image representation allows the possibility of finding a distinct subgraph which separates negative examples from positive examples. Our Subdue algorithm can be used to find such a subgraph. In our current work, IGERT Trainee Seth Long is investigating a method for displaying the subgraphs found to be highly discriminating overlaid on the MRI, such that the reason for the classification will be readily apparent. We also extend our previous work on classification to images of the brain that are extracted from the skull and we are finding a significant improvement in accuracy. Classification criteria examined are age, level of education, and Alzheimer’s Disease.
Shape is represented as a graph by recursively subdividing the image into 8 equal boxes, forming a 2×2×2 grid at each subdivision. Subdivision is continued until each box is either sufficiently uniform in color, or the depth limit is reached. A tree is formed from this subdivision process, with each division forming a node, and each box which will not be further subdivided forming a leaf. The tree size can be tailored by limiting the maximum depth or adjusting the requirement for uniform color. Nodes are labeled to indicate reason for termination, and edges are labeled to indicate which subdivision they represent. This allows area represented by any node to be located in 3D space.
Unlike our previous work, this method is applied to the entire brain, with the result that no scans cannot be processed due to the ventricular discovery issues noted by Long and Holder. Accuracy is also increased by using the whole-brain approach. A bounding box is formed to crop edges away from the extracted brain, and the graph representation is formed from the area inside this bounding box. Inaccurate brain extraction, such as leaving artifacts in the image, changes the location of this bounding box, which in turn alters which neural structures correspond to each subdivision.
Graph Classification is performed by ranking each branch according to disparity of occurrences between two classes. A branch which appears in every example of one class but none of the other receives a maximal score, and a branch which occurs equally often in both classes receives a minimal score. The highest ranking branches are selected to be used as features in a set of feature vectors describing the graphs. Further details are given in (Long and Holder 2012). This provides an opportunity for a comprehensible hypothesis which has not been previously exploited. It is possible to visualize the features present in an image by calculating the area represented by the leaf of each discriminating branch. This can be overlaid on 2D sections of the image. On a per-image basis, areas of the image relating to discriminating branches are boxed using colors to indicate meaning of the branch, and whether found or not.
Color scheme for the horizontal bars on the box is:
- branch terminates in the brain: blue
- branch terminates outside the brain: yellow
- branch terminates indeterminate result (depth cutoff or non-leaf): orange
Color scheme for the vertical sides of the box is:
- branch is prevalent in positive class and found in image: green
- negative class and found in image: red
- positive class and absent: yellow
- negative class and absent: blue
These colors were chosen because they are distinct from one another when displayed in grayscale. They are shown in legend format in the included figure. Note that the system makes no internal distinction between negative and positive class. Switching class labels has no affect on accuracy, and assignment of these labels can be arbitrary provided it is consistent.
The included picture shows an image of an 65 year old Alzheimer’s Patient. We tested our algorithm on the OASIS dataset containing MRI scans from 100 individuals diagnosed with Alzheimer’s Disease. Accuracy on a 60-sample dataset constructed using only the CDR 1.0 and 2.0 and 30 randomly selected healthy examples results in an accuracy of 88.3%. This is an increase from 79.3% reported earlier.
Address Goals
This is a radically new approach to brain MRI analysis. This approach to the work was made possible because the student and the faculty advisor were jointly trained in areas of neuroscience, computer science, and gerontology.
