

Highlight
GPU-Accelerated Statistical Software for Environmental Data Analysis
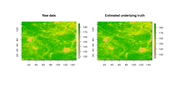
Vegetation Intensity in Eastern Iowa, July 2012
Achievement/Results
Kate Cowles’s IGERT research group at The University of Iowa developed two new statistical software packages, CARramps and CARrampsOcl, for analyzing and visualizing large collections of environmental data. Both packages can be downloaded at no charge from The Comprehensive R Archive Network (www.cran.r-project.org) and are open source, meaning that users can see all the code and modify it if they wish. CARramps and CARrampsOcl are useful in analyzing data measured over space and time — for example, data on vegetation intensity derived from satellite images, in which daily values are recorded for each image unit (or pixel) in a region. Such data present challenges to environmental research because they typically include “noise” — random error introduced by atmospheric and other factors. Unfortunately, the computational methods used to try to remove the noise and estimate the true underlying values tend to be very slow, and often are performed on expensive supercomputers or clusters of multiple workstations.
CARramps and CARrampsOcl harness the power of graphical processing units (GPUs) to speed computation by up to 90 fold. The GPU is the graphics card that drives the display on an ordinary computer. The CARramps package can run only on computers with Nvidia graphics cards because it uses CUDA — Nvidia’s proprietary language for mathematical computing on GPUs. Based instead on the open source OpenCL framework for GPU computing provided by the Khronos Group, CARrampsOcl can perform its computations on GPUs from both major vendors (Nvidia and AMD), and potentially on other accelerator hardware. Both CARramps and CARrampsOcl run in the free and open-source R statistical computing environment under the free, open-source Linux operating system. In short, these packages enable a researcher or student with a moderately-priced desktop or laptop computer (such as would be suitable for gaming or business graphics) to apply statistical and graphical methods to spatial and temporal data at no additional cost for software.
CARrampsOcl was developed by an interdisciplinary team with expertise in spatial statistics, high-performance computing, graphics, and geography. The team consists of two IGERT faculty members — Kate Cowles (Statistics) and Marc Linderman (Geography), — three IGERT trainees — Juan Cervantes, Danielle Dodgen, and Alex Sawyer — and an undergraduate, Michael Seedorff. The example image presents data on vegetation intensity in eastern Iowa during two weeks in July of 2012 — a period of drought in the Midwest. Each pixel is one square kilometer. The numeric value represented by each pixel color is Normalized Difference Vegetation Index (NDVI) — a measure of the greenness of vegetation calculated from patterns of reflected light. Such light reflectance data are collected by a sensor called the Advanced Very High Resolution Radiometer (AVHRR) onboard a National Oceanic and Atmospheric Administration (NOAA) weather satellite as it orbits the earth daily. The data presented here were extracted from an image downloaded from the USGS EROS Center (http://phenology.cr.usgs.gov).
In the color scheme used in our images, the highest NDVI values are shown in dark green, with yellow, pink, and white indicating lower and lower values. Very-low-vegetation areas such as cities and wide rivers appear in pink. Many of the yellow areas, suggesting unhealthy vegetation, are drought-afflicted fields. The original NDVI data are in the left image, and the slightly-smoothed surface estimated by CARramps is on the right. Since the original NDVI data had undergone some preprocessing, it is not surprising that CARramps found only a little measurement error to remove and has made only subtle adjustments to the original data.
Address Goals
The development of CARramps and CARrampsOcl contributes to the nation’s research infrastructure by making innovative use of scientific programming for graphical processing units for statistical analysis and visualization of spatiotemporal data. This free software runs on readily-available, low-cost computers commonly used by the general public and does so at speeds usually associated with expensive “mainframes” or clusters. It fosters research in environmental and climate sciences by providing software for analysis of environmental data that is easily accessible by researchers and students.
