

Highlight Photo
GPU-Accelerated Statistical Software for Environmental Data Analysis
Vegetation Intensity in Eastern Iowa, July 2012
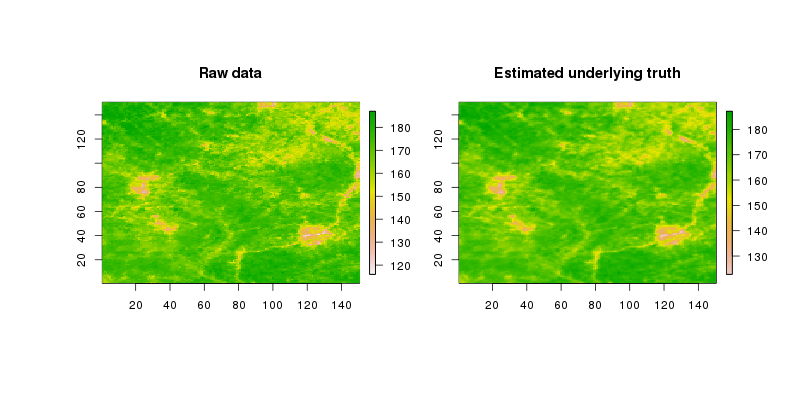
The images present data on vegetation intensity in eastern Iowa during two weeks in July of 2012 — a period of drought in the Midwest. Each pixel is one square kilometer. The numeric value represented by each pixel color is Normalized Difference Vegetation Index (NDVI) — a measure of the greenness of vegetation calculated from patterns of reflected light. Such light reflectance data are collected by a sensor called the Advanced Very High Resolution Radiometer (AVHRR) onboard a National Oceanic and Atmospheric Administration (NOAA) weather satellite as it orbits the earth daily. In the color scheme used in our images, the highest NDVI values are shown in dark green, with yellow, pink, and white indicating lower and lower values. Low-vegetation cities and wide rivers appear in pink. Many of the yellow areas, suggesting unhealthy are drought-afflicted fields. The original NDVI data are in the left image, and the subtly-smoothed surface estimated by software is on the right.
Credits: The source for this data was the USGS EROS Center (http://phenology.cr.usgs.gov/)
